One of the key benefits of delivering remote desktop services via the MyCloudIT platform is that you can review and visualize your RDS usage and billing information across multiple subscriptions from a single dashboard.
Navigate to the Billing panel under your account in the Dashboard.
Cost Assessment at All Levels
Keep track of your spending on RDS delivery from a single dashboard. Our pie chart shows the current billing information at the subscription and deployment levels. The pie chart only displays the costs that MyCloudIT will charge you, including MyCloudIT licenses, Azure consumption and SPLA if purchased via MyCloudIT.
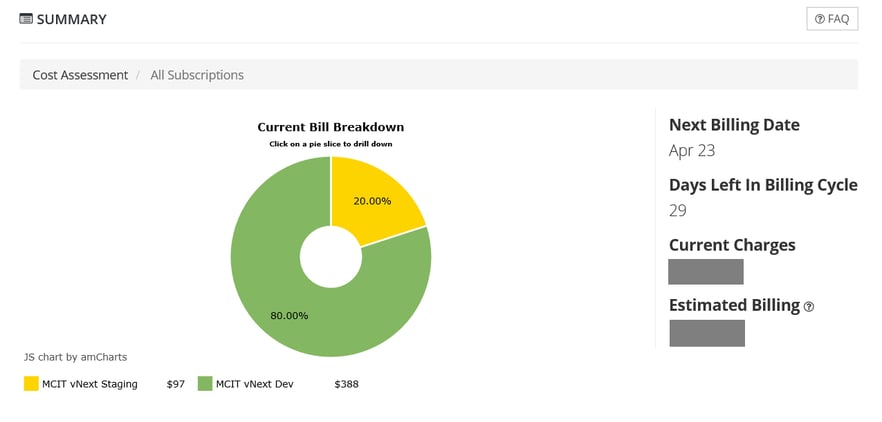
First Level: Subscriptions per Account
Scenario 1: Bring-your-own Azure. The summary chart doesn’t include Azure consumption data.
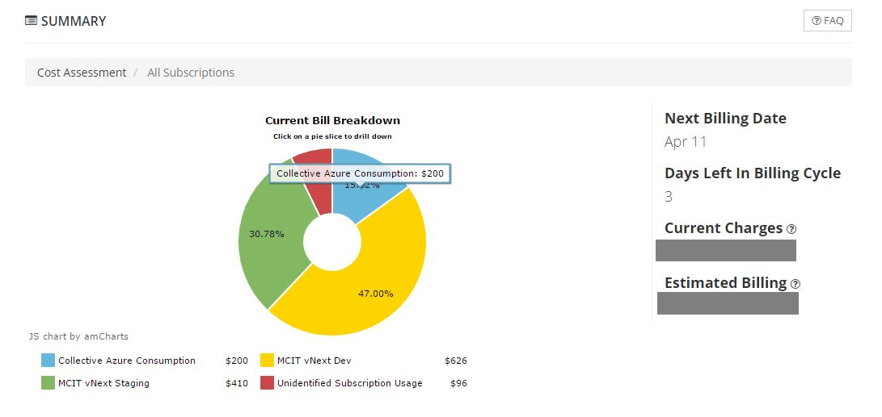
Scenario 2: Purchase Azure via MyCloudIT. The chart also includes collective Azure consumption across subscriptions.
Click on a pie slice to drill down to the next level.
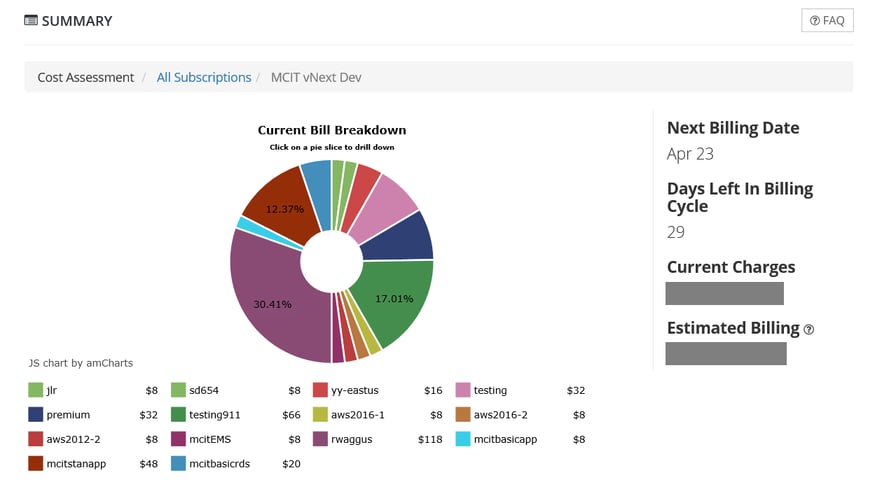
Second Level: Deployments per Subscription
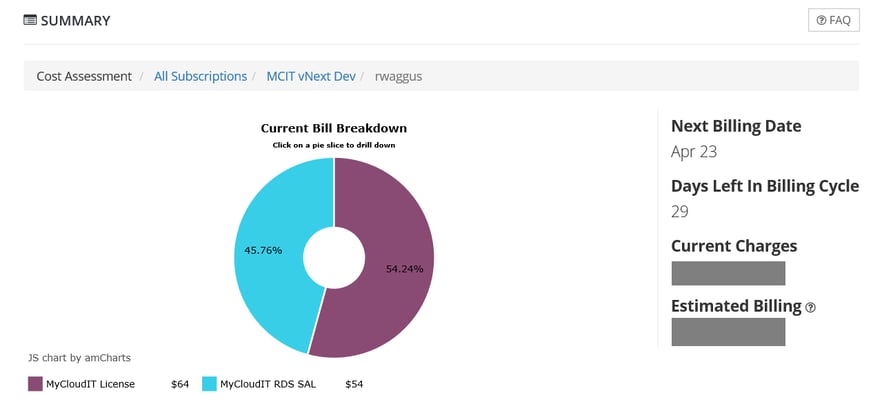
Third Level: A breakdown cost of each Deployment.
Azure Consumption Tracking
The Azure Consumption pane allows you to understand the your Azure consumption habit.
MyCloudIT Billing panel displays the recent Azure consumption in the last 3, 7, 15, or 30 days. You can choose to view this data in a table format or a chart format.
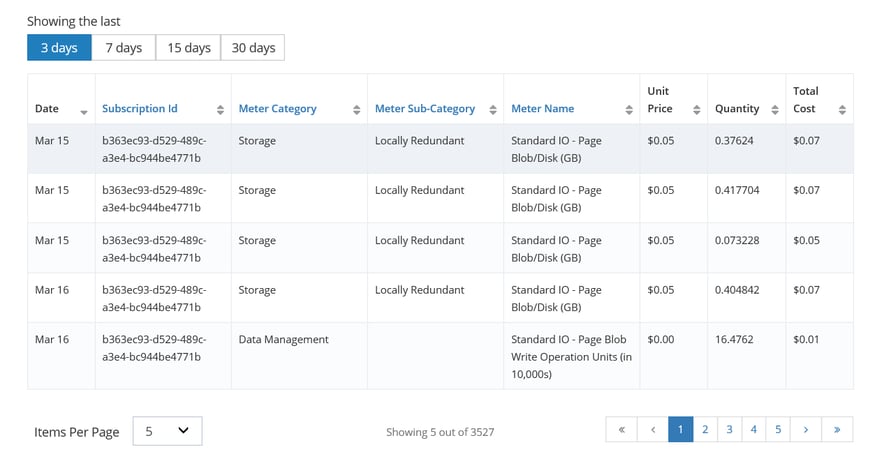
The table view is usually used to review the unit price, quantity and total cost of each meter category.
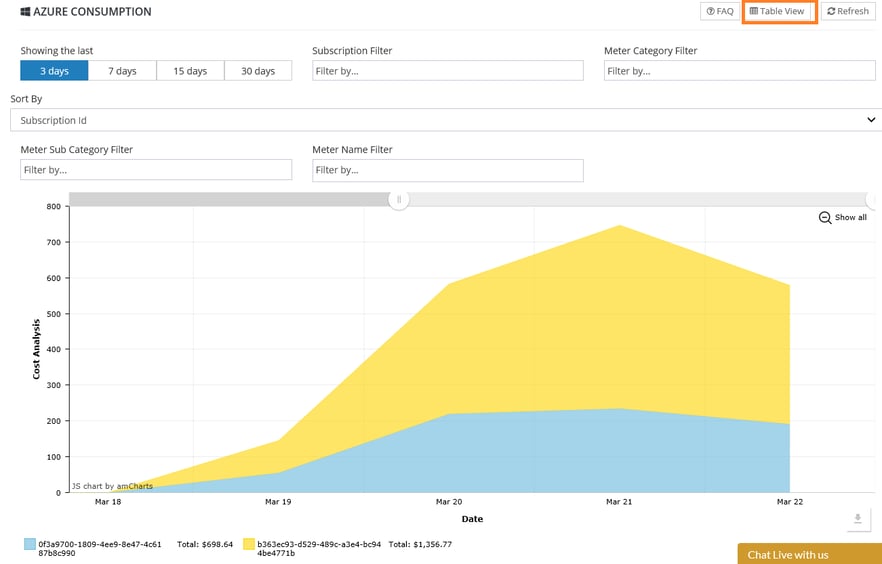
The chart view is usually used to troubleshoot any unusual peak or drop in Azure consumption.
There are also options to download the chart image, save the table data and add annotations to explain sudden changes in Azure consumption.
How to Take Advantage of MyCloudIT Billing Panel?
Here are some of the scenarios that are made possible with the new MyCloudIT Billing portal:
- Predict bill: You can get your estimated consumption and cloud spending to predict what your bill would be at the end of the billing cycle.
- Scale up and down: Scale up and down your deployment based on the Azure usage report to ensure all-time availability and efficiency for your organization.
- What-if analysis:
- You can help customers determine whether it would be more cost effective to run their workloads in another region, or on another configuration of the Azure resource. Azure resource costs may differ based on the Azure region or VM instances in which they are running This allows you to get cost optimizations.
- You can help customers determine if another Azure offer type gives a better rate on an Azure resource. For example, you can take advantage of this Dv2 limited-time promotion.
For more questions, feel free to refer to this user guide or send us an email at support@mycloudit.com.
Want Future News and Updates Emailed Right to Your Inbox?